|
|
 |
Scoring gels using DAxColour viewsBinning sheets Advantages |
|
DAx will readily load data from ABI Genescan® fragment analysis files (*.fsa, *.abi), Amersham
MegaBACE™ files (*.rsd, *.esd), as well
as Staden SCF files (*.scf). Sizing information is retrieved from the file, or can be readily derived using
Automatic Trace Calibration (ATC). The data are displayed either as traces or as a colour view "gel" image, with either a calibrated or unaltered axis.  Calibrated colour view of 11 data files, with 3 traces in each file displayed per lane (ROX - red, FAM - green, and HEX - blue). Traces can also be displayed individually, one per lane. DAx uses powerful binning sheets to display data on peaks in multiple traces. Bins can be defined by double clicking on, or clicking & dragging the mouse across a band in the colour view. Each bin in the binning sheet can be displayed on a single line or wrapped across multiple lines. Trace samples ("thumbnails") can be displayed in the binning sheet. The user can mark or unmark peaks by double clicking on the trace samples. 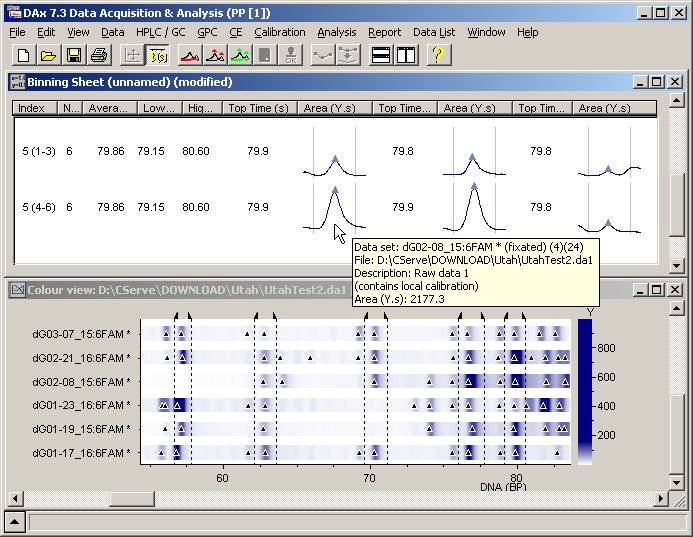 Colour view with user defined bins, and binning sheet showing only the fifth bin with trace samples. Note the faint yellow tooltip window displaying specifics about the peak under the mouse cursor. When the mouse is moved over the colour view, the appropriate cell in the binning sheet is brought into view and highlighted. Advantages of DAx
For a detailed manual on how to use DAx to score gels, click here. |